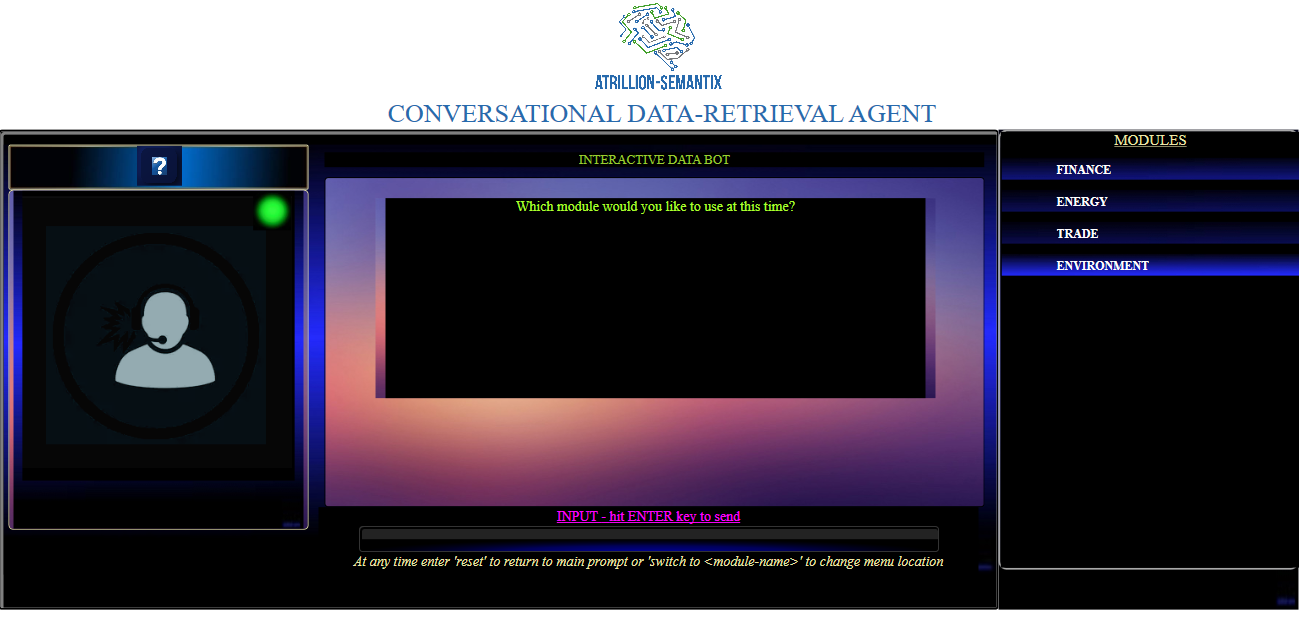
Interactive Data Console
The Interactive Data Console is a Conversational API Data Browser that retrieves input Parameters from the user using simple dialogs, then displays the resultant data visually. It accesses several useful API data stores available online. Here’s how it works:
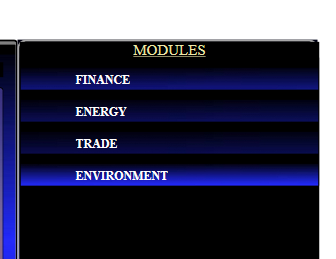
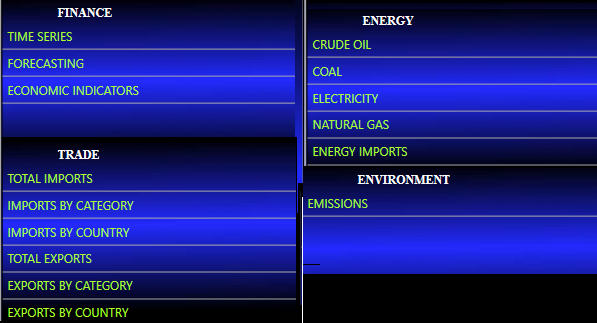
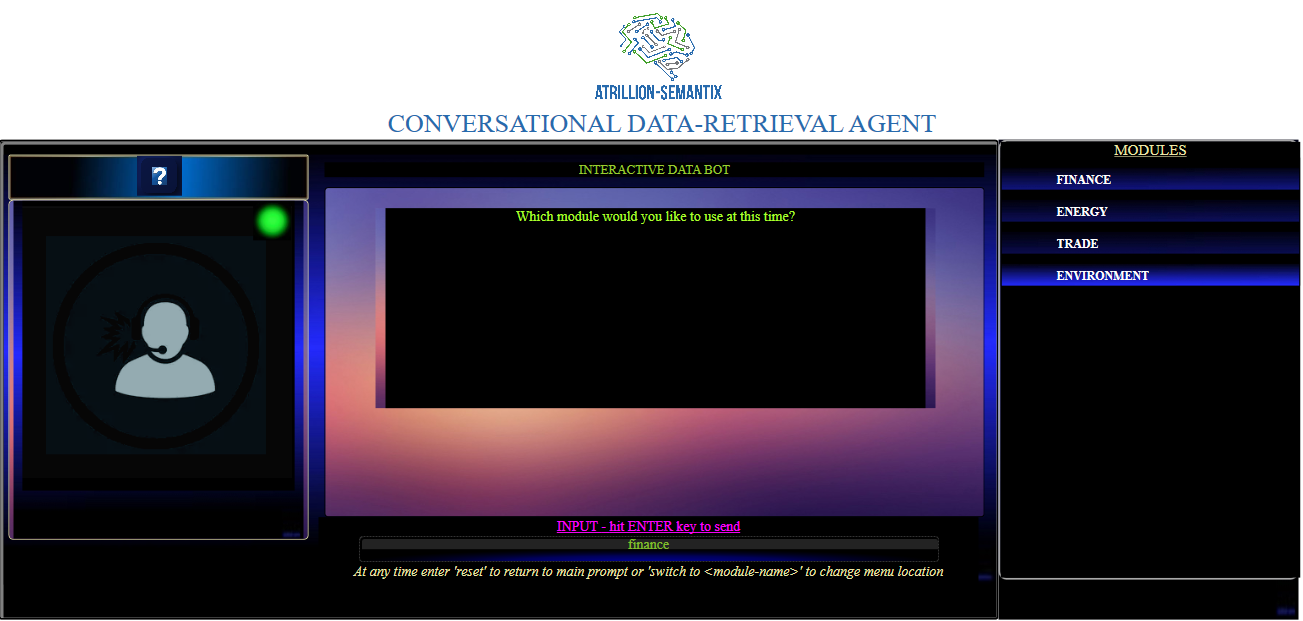
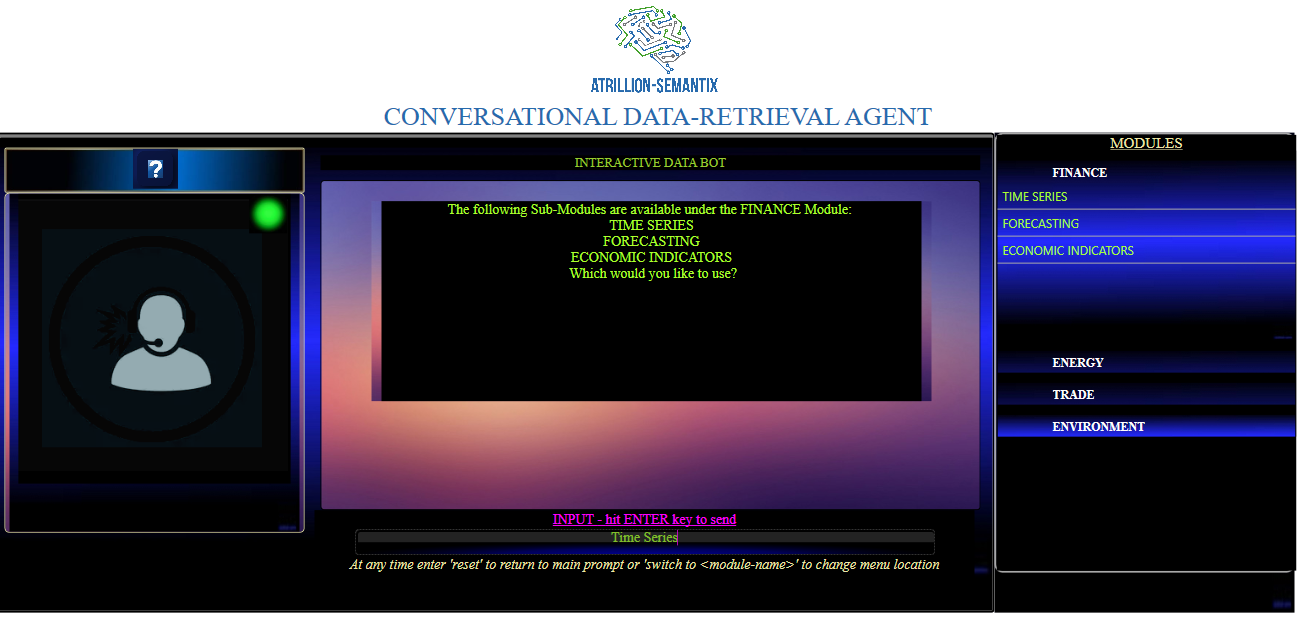
The front page consists of a list of available “Modules” on the right-hand side and an interactive dialog-agent in the center. Each of the modules listed reflects a “General” category of Data, under which any number of sub-modules is listed as shown here:
First the List of Currently Available Modules
Sub-module list:
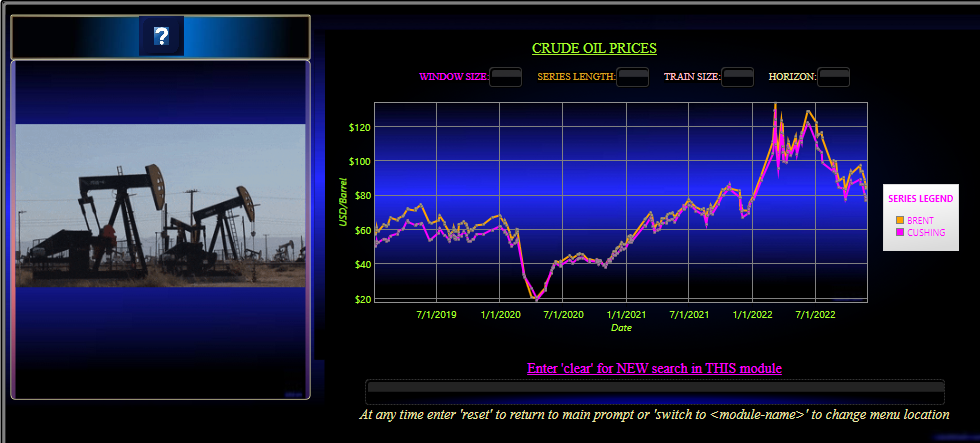
When you open up the application, the first question asks you which of the Modules you would like to engage. When you select one, it’s sub-modules are revealed and again you select from which you wish to access its data. Once selected, the agent will engage the user in a simple dialog in order to retrieve the parameters of the query, for example “Please enter the begin date (YYYY-MM) for when you wish to view crude oil data” or “For how many weeks would you like to forecast stock price data?” etc. When ALL the relevant query information has been collected by the agent, the API call is made and the resultant data is displayed. An example of that process as described is shown below:
Interactive Data Console


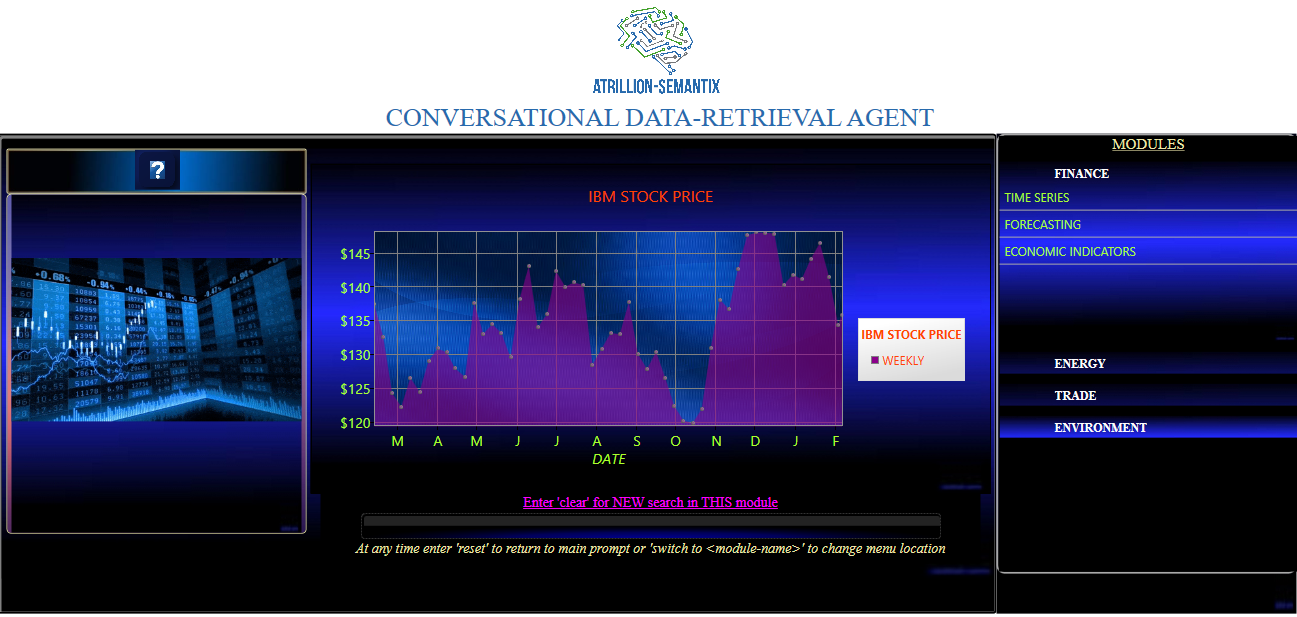
At this point the user may “Switch To” a different Module or enter “clear” in order to make the same API call but with a different ticker symbol.
This process is the same for each Module/Sub-Module.
The Interactive Data Console is NOW AVAILABLE in the store.